I'm a great believer in using different kinds of data to measure how well pupils are doing, not all of which are quantifiable in the usual sense.
Read More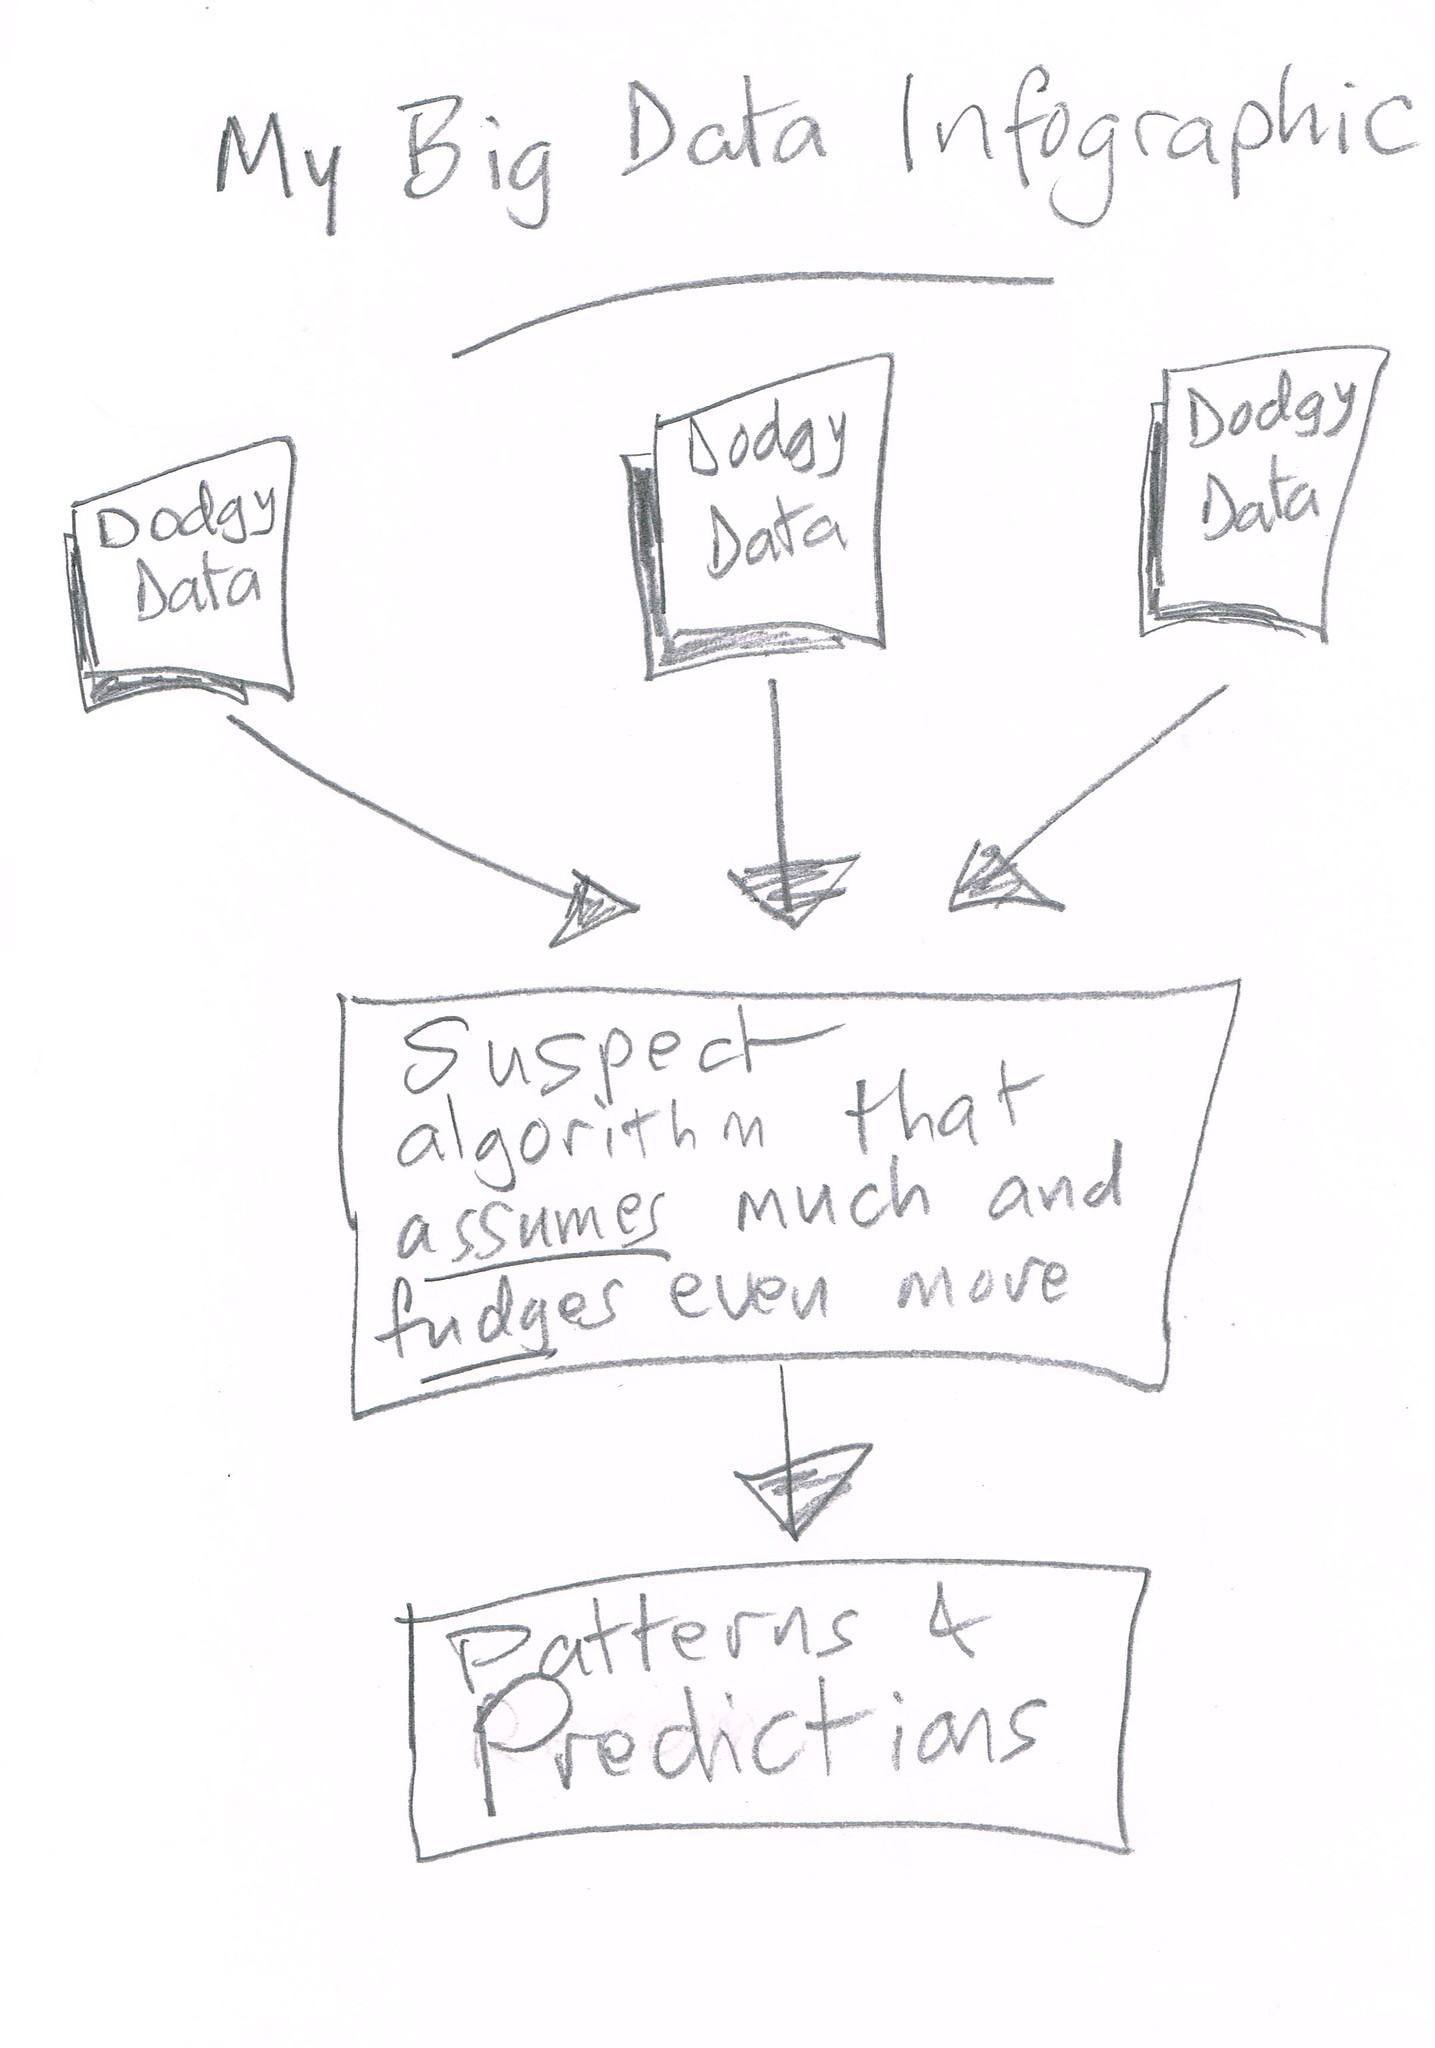
Big Data, by Terry Freedman
Data for its own sake is pointless
Unless data can be turned into information, what’s the point of collecting it?
Read More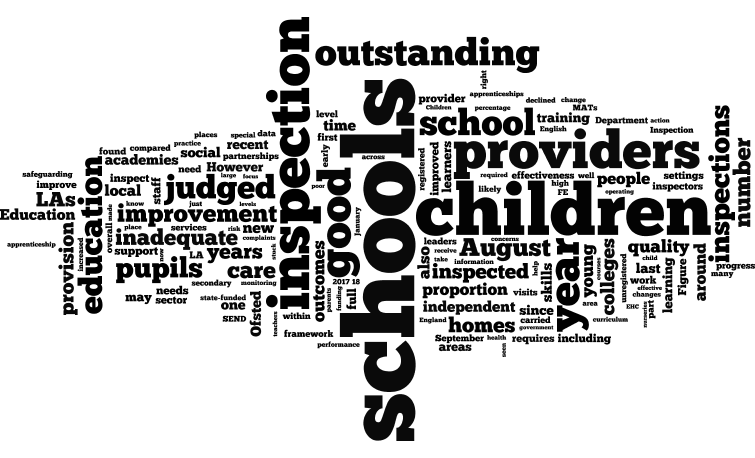
Wordle of the Ofsted annual report.
Evidence-based education revisited
A reflection on the contents of the 2017-18 annual Ofsted report as summarised in a word cloud.
Read More
Research reporting: how do you know if it's just fake news?
I’ve created an infographic on this topic. Read on for more details.
Read More
Photo from pixabay.com Licence: CC0
Research, Alternative Facts or Fake News?
How can you tell whether news reports of new research in ed tech are accurate? I’ve created an 8-point infographic for this, based on my own work in this area. Read on to find out more, and how you can get hold of it.
Read MoreAll change for Digital Education
Important news for subscribers to my newsletter, Digital Education
Read MoreQualitative data is important too
I'm a great believer in using different kinds of data to measure how well pupils are doing, not all of which are quantifiable in the usual sense.
Read More
The book is available as an iBook or a PDF
What I've been reading: Thinking Critically with Digital Media
This book by Nik Peachey is an excellent resource book for teachers of media and digital literacy.
Read More
Photo from Ian Stannard CC BY-SA 2.0
3 e-safety pins
Here are three useful pins from Pinterest on the subject of e-safety for kids.
Read MoreA generic classroom activity for dealing with fake news
Fake news is in the news -- unless, of course, that is not itself fake news! Here's an infographic summarising a generic classroom activity, plus details of how to get a lot more information.
Read MoreArticles on Ed Tech: Retrospective #5
Here are some articles you may have missed in the past week or so. Topics featured include inspection, book reviews and Word macros.
Read MoreBig data infographic
Here is a big data infographic I produced in 2014.
Read MoreMy Big Data Infographic
 I’ve been working on a long-ish article about big data for my newsletter, Digital Education. To give you a hint of some of my misgivings, here is a diagram I prepared to illustrate some of my points.
Schools’ approach to assessment without Levels
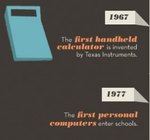
A history of data storage and recovery
I once mentioned to the kids I was teaching how useful I found having CD-ROMs to store stuff on. “What?!”, they said. “You had CDs back then?”
Young people always seem to have a working assumption in life that the technology they use only came into existence when they did. Anything else is ancient history. With that in mind, perhaps your pupils will find the infographic below useful and interesting. It charts the development of data storage and recovery from the time of Babbage, in 1834. Along the way there are interesting articles, photos and videos.
The internet in a day
 Here is an infographic that depicts what happens in an internet day. It goes through what happens in one second, one minute, one hour and then calculates the statistics for a day.
It’s interesting, though not – in my opinion – for the statistics in themselves. If big numbers impress you, then you will be impressed. Indeed, those whose mission it is to promote so-called 21st century skills and to prove that the current education system cannot cope with the new reality tend to use statistics like this to prove their point.
The Statistics of cloud computing
Here’s an interesting infographic on the extent to which cloud computing is used.
Read MoreThe Evolution of Educational Technology
 Here’s an interesting infographic which looks at how educational technology has changed over the centuries. I think it’s always interesting to provide students with some history of the subject it didn’t all start with iPads!
Learning tools over the years
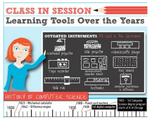 Here’s an interesting infographic which looks at how the technology used in the classroom has changed over the years (or remained pretty much the same!). The only one of the “outdated instruments” I never used was a slide rule! How many of these do you remember? And please don’t send me messages along the lines of “Before my time, Terry.” I feel ancient enough when I look at things like this already! The infographic includes the history of Computer Science.