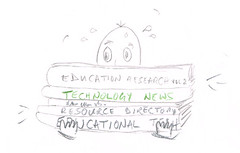
I’ve been working on a long-ish article about big data for my newsletter, Digital Education. To give you a hint of some of my misgivings, here is a diagram I prepared to illustrate some of my points.
 OK, so I'm sceptical about the value of big data.
You may think that it’s not really an infographic, because it doesn’t contain any information. But actually it does, if you think about it. What it does not contain is any data, which is somewhat ironic if you come to think about it.
Another article in the newsletter will be a follow on from The things you can do with data! Part 1. I thought I’d call it The things you can do with data! Part 2.
There are also research updates from Peter Twining and Mike Sharples, an article by Mel Thompson on whether philosophy should influence government policy, plus plenty of practical stuff as usual. I’ll announce more details when I’m about to publish it!
 Your newsletter editor is hard at work doing research for Digital Education, the free newsletter for education professionals. Have you subscribed yet?
Read more about it, and subscribe, on the Newsletter page of the ICT in Education website.
We use a double opt-in system, and you won’t get spammed.
